Contents
- Introduction
- About this Survey
- Our Services
- What Bassetlaw District Council does
- Your Council Tax and how the Council is Funded
- Survey Results
- Question 1: Which of the following best describes you?
- Question 2: Satisfaction with your local area as a place to live
- Question 3: Overall, how satisfied, or dissatisfied are you with the way Bassetlaw District Council runs things?
- Question 4: How well informed do you think Bassetlaw District Council keeps residents about the services and benefits it provides?
- Question 5: The Council has several ways it can balance its budget. Please rank the following options in order of preference. (1 most preferrable, 5 least preferable).
- Question 6: Which of the following statements do you mostly agree with? (Please tick one option per service area).
- Question 7: How often do you use the following Council services?
- Question 8: Are there any other ways we can use to balance the budget?
- Demographic of Respondents
Introduction
In 2023 we launched our ambitious Vision 2040 which seeks to transform our district into a hub of new technologies, to regenerate our town centres in the process, and to genuinely improve the opportunities and life chances for Bassetlaw residents of all ages and backgrounds. We will do this alongside promoting greener and more sustainable ways of living and “doing business”.
A key part of delivering Vision 2040 is to build the financial resilience of the Council, so we can maximise the benefits of opportunities like the STEP Fusion Energy project at West Burton, support our communities facing cost of living pressures and continue to deliver quality services to residents.
To build this resilience the Council must be pro-active in how we manage our finances and take action to deal with emerging pressures. Funding from central Government has reduced significantly over the last decade and costs have risen due to inflation, including increases in energy, fuel and the cost of materials.
The Council’s Medium Term Financial Plan (MTFP) sets out our expected financial position over the next five years and is projecting a budget shortfall of £3.8million to March 2030.
As part of our approach to tackling this shortfall, we want to know what services matter most to our residents and businesses, find out which services people use the most and capture any ideas the public may have on how to balance our budgets. This information will then be used by Councillors and Officers during the budget setting process, culminating in the annual budget meeting on 27th February 2025 at Retford Town Hall. At this meeting the Council will agree its budget for the next financial year and crucially, agree yearly savings targets for the next five years until 2030.
Please take the time to tell us your views. Your feedback will be crucial in helping inform the decisions we make. Your responses are highly valued, and we thank you for your time in helping us shape our future services.
Councillor Julie Leigh, Leader of the Council.
Councillor Alan Rhodes, Cabinet Member for Corporate and Financial Services.
About this Survey
The Council’s financial year runs from 1st April to 31st March. This means that we start setting our annual budget for the following year in October. As part of this process, we would like residents and businesses to let us know what is important to them.
In this survey you will be asked about how satisfied you are with your area and the Council, how we should balance our budget and whether you think Council services should either be; funded, reduced or stopped, or transformed to deliver cost savings. There are also some standard demographic questions that help us understand the views of different groups and of people living in different areas of the district.
The results of the survey will be presented to Cabinet on 6th February 2025 as part of the General Fund Budget 2025/26 to 2029/30 report. This report will set out the considerations that have had to be made to balance the budget for 2025/26 and to establish savings targets for future years.
We will also publish the result of the survey on our website in January 2025.
The survey runs from 1st November 2024 to the 12th December 2024. The easiest way to complete this survey is online. This survey should take approximately 5 minutes to complete.
You can also return paper versions of the survey to Bassetlaw District Council, Queen’s Buildings, Potter Street, Worksop, S80 2AH or leave them in one of the ballot boxes next to where you picked up your survey.
We can also provide alternative formats on request, including large print and translations. Please email policy@bassetlaw.gov.uk
Prize Draw
If you would like to take part in a prize to win one of six £25 love to shop vouchers, please tick the box and provide your contact details on completion of the survey.
Bassetlaw District Council will only use this data for the purpose of contacting the winners of the prize draw and it will be destroyed once all winners have been notified.
Our Services
Below are just some of the ways we used your money in the year 2023/24 to maintain and enhance the district for our 118,000 residents.
- Bedding plants planted - 77,102
- Rounds of Golf - 41,000
- Tonnes of waste recycled and composted - 12,795
- Shopmobility users - 4,570
- Visitors to Council offices - 27,821
- Residents on Electoral Register - 89,907
- Food outlets inspected - 480
- Health and safety visits - 252
- Visits to parks and open spaces - 250,000
- Tonnes collected by street sweepers - 1,793
- Telephone calls handled by Customer Services - 505,237
- Planning decisions issued, 1,250
- Households prevented from becoming homeless - 86
- Playgrounds inspected weekly - 37
- Housing Benefit cases handled - 3,388
- Litter bins provided across the district - 1,556
- Allotment plots let - 679
- Businesses received green grants - 30
- Woodlands managed - 6
- CCTV cameras monitored - 363
- Number of pre-start and start up businesses receiving support - 164
- Tonnes of glass collected from Council bring sites in Bassetlaw - 1,036
- Visitors to Council Leisure facilities - 874,646
- Pupils visited Bassetlaw Museum - 2,631
What Bassetlaw District Council does
Nottinghamshire has a two-tier system of local government. This means in Bassetlaw, services are provided between two Councils. These are Nottinghamshire County Council and Bassetlaw District Council. Many rural areas are also represented by Parish Councils as well.
Bassetlaw, as a District Council, provides the following services:
Business and skills - Support to local businesses, Retford Enterprise CEntre, Middleton's Yard, The Bridge Skills Hub, Markets.
Leisure and Cultural Services - Parks and Open Spaces, Allotments, Splash Pools, Museum, Leisure Centres.
Supporting our Communities - Community Safety, CCTV and Anti-Social Behaviour, Environmental Health, Strategic Housing and Homelessness, Licensing, Planning & Building Control, Customer Services, Policy & Communications, Council Tax and Business Rates collection, Benefits.
Waste and Recycling - Bin collections, Street Cleaning, Fly-Tipping.
Property and Estate Management - Office Buildings, Town Halls, Car Parks, Cemeteries, Worksop Creative Village, Industrial Estates and Units, Commercial assets.
Running the Council - Finance, Legal Services, IT, HR, Democratic Services, Elections.
The following services are provided by Nottinghamshire County Council and other public sector organisations, NOT Bassetlaw District Council.
For this Budget conversation, please do not comment on the following services:
- Highways and road repairs.
- Household waste and recycling centres.
- Children's services, schools and education provision.
- Community and public transport.
- Adult social care.
Your Council Tax and how the Council is Funded
Bassetlaw District Council collects Council Tax on behalf other authorities and public sector partners. The chart below shows the percentage of Council Tax you pay to each organisation. For every £1 you spend on Council Tax, 8.25p goes to Bassetlaw District Council.
| Percentage of Council Tax | Cost of Service | Percentage of Service |
|---|---|---|
| Nottinghamshire County Council | £1,807.08 | 74.56% |
| Notts Police and Crime Commissioner |
£282.15 |
11.64% |
| Bassetlaw District Council |
£199.92 |
8.25% |
|
Notts Fire & Rescue Authority |
£92.21 |
3.80% |
|
Parish & Charter Trustee Precepts |
£42.39 |
1.75% |
|
Average Band D Council Tax |
£2,423.75 |
100.00% |
What you pay towards Bassetlaw District Council Services per day
Properties across the United Kingdom are separated into valuation bands from A-H, based on a variety of factors such as the size of the property, layout, location, and value. Within Bassetlaw, approximately 50% of all properties fall within Band A.
Council Tax Band (per day)
- Band A - 37p
- Band B - 43p
- Band C - 49p
- Band D - 55p
- Band E - 67p
- Band F - 79p
- Band G - 91p
- Band H - £1.10
How we spend our Budget
At Bassetlaw District Council, 80% of our budget is funded through grants and other income such as fees and charges and Business Rates. That means only 20% of our budget is paid for through your Council Tax.
| Budget 2024/25 | £m | % |
|---|---|---|
| Supporting our communities | 6.0 | 28.8% |
| Running the Council | 4.1 | 19.6% |
| Leisure and cultural services | 4.0 | 19.1% |
| Waste and recycling | 3.0 | 14.3% |
| Property and estate management | 2.2 | 10.5% |
| Business and skills | 1.6 | 7.8% |
| Total | 20.9 | 100.0% |
Survey Results
- Status of survey - closed
- Start date - 01/11/2024
- End date - 12/12/2024
- Total valid responses - 833
- Electronic - 818
- Paper - 15
- Margin of error - 3 percentage points + / - with a 95% confidence level
Question 1
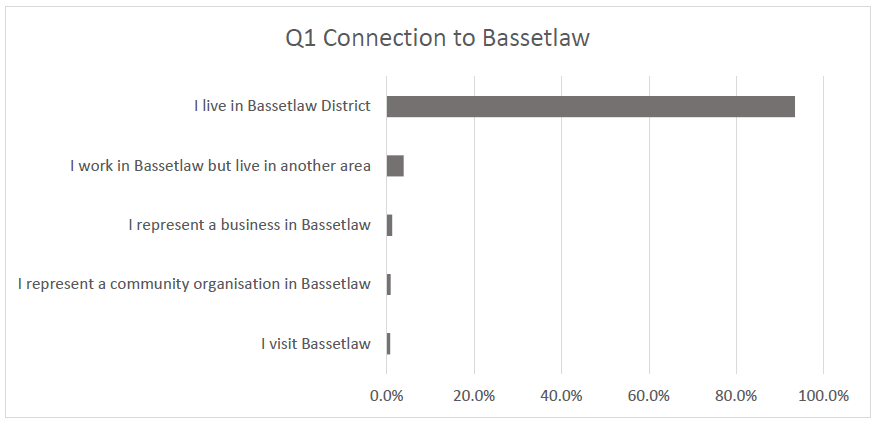
Which of the following best describes you?
93.4% of respondents described themselves as “Living in Bassetlaw”. 3.9% “work in Bassetlaw but live in another area”.
| Response | Percentage |
|---|---|
| I live in Bassetlaw | 93.4% |
| I work in Bassetlaw, but live in another area | 3.9% |
| I represent a business in Bassetlaw | 1.2% |
| I represent a community organisation in Bassetlaw | 0.8% |
| I visit Bassetlaw | 0.7% |
Question 2
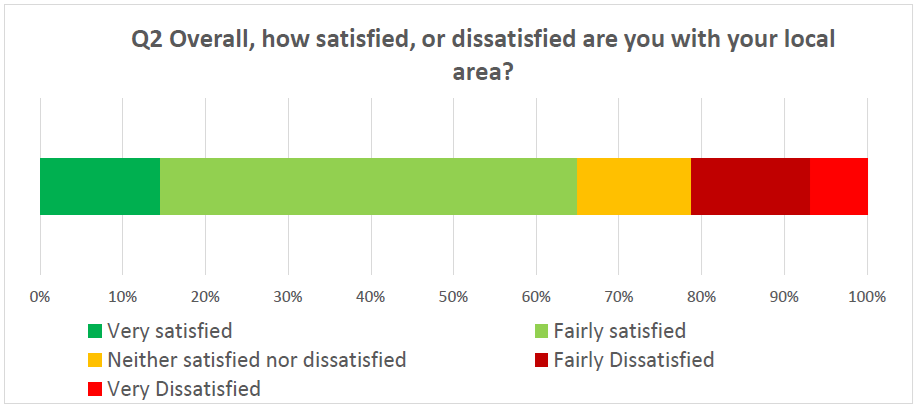
Satisfaction with your local area as a place to live.
As a resident satisfaction question, results for this question excluded responses from the following categories:
- I visit Bassetlaw
- I work in Bassetlaw, but live in another area
- I represent a business in Bassetlaw
- I represent a community organisation in Bassetlaw
64.9% of residents report they are satisfied with Bassetlaw as their local area.
| Response | Percentage |
|---|---|
| Very dissatisfied | 6.8% |
| Fairly dissatisfied | 14.5% |
| Neither satisfied nor dissatisfied | 13.8% |
| Fairly satisfied | 50.3% |
| Very satisfied | 14.6% |
| Fairly or very satisfied | 64.9% |
Question 3
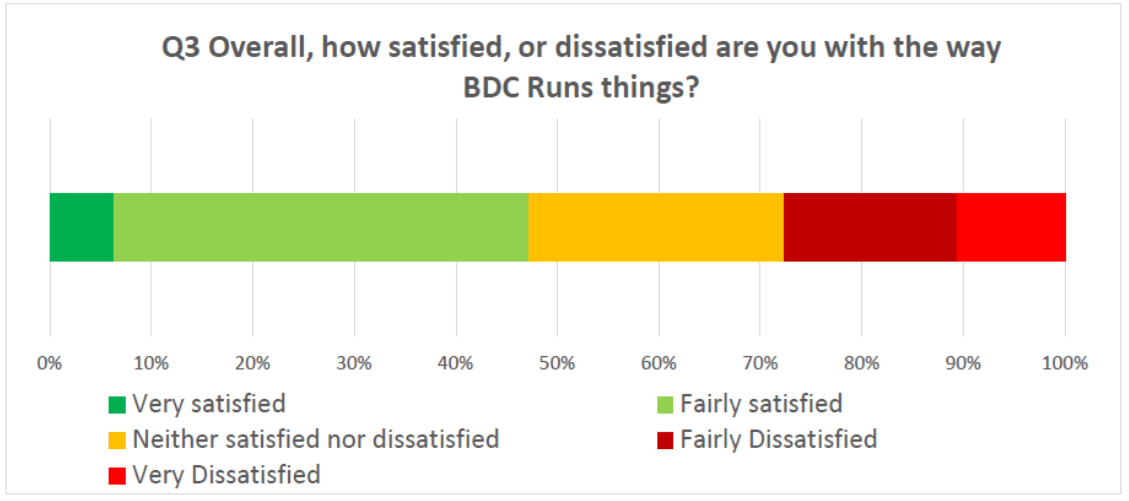
Satisfaction with Bassetlaw District Council.
As a resident satisfaction question, results for this question excluded responses from the following categories:
- I visit Bassetlaw
- I work in Bassetlaw but live in another area
- I represent a business in Bassetlaw
- I represent a community organisation in Bassetlaw
47.2% of residents report they are satisfied with the way Bassetlaw District Council runs things.
| Response | Percentage |
|---|---|
| Very dissatisfied | 10.7% |
| Fairly dissatisfied | 17.0% |
| Neither satisfied nor dissatisfied | 25.1% |
| Fairly satisfied | 40.8% |
| Very satisfied | 6.4% |
| Fairly or very satisfied | 47.2% |
Question 4
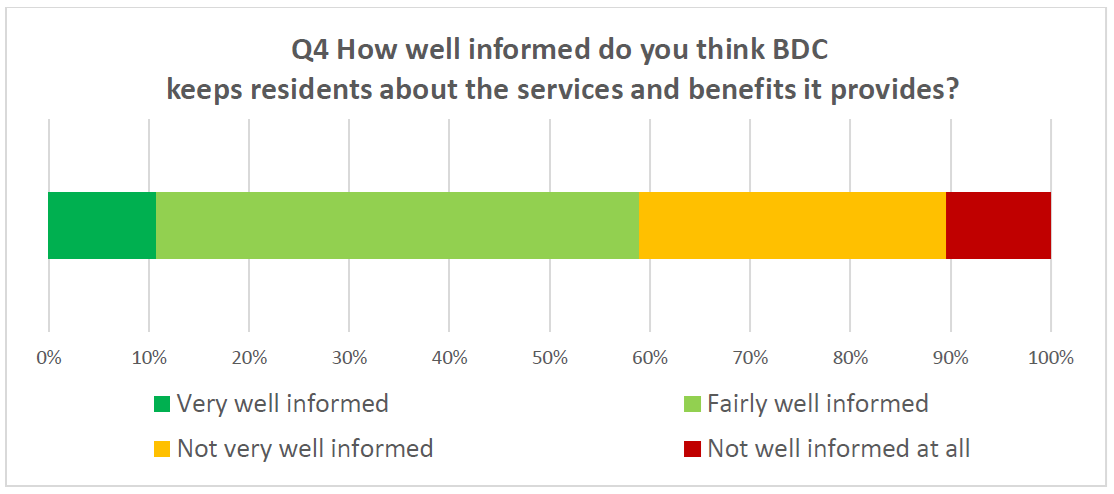
How well informed do you think Bassetlaw District Council keeps residents about the services and benefits it provides?
As a resident satisfaction question, results for this question excluded responses from the following categories:
- I visit Bassetlaw
- I work in Bassetlaw but live in another area
- I represent a business in Bassetlaw
- I represent a community organisation in Bassetlaw
59.0% of residents are very or fairly well informed about services and benefits Bassetlaw District Council provides.
| Response | Percentage |
|---|---|
| Not well informed at all | 10.4% |
| Not very well informed | 30.6% |
| Fairly well informed | 48.2% |
| Very well informed | 10.8% |
| Fairly or very well informed | 59.0% |
Question 5
The Council has several ways it can balance its budget. Please rank the following options in order of preference. (1 most preferrable, 5 least preferable).
- Raising the level of Council Tax
- Raising the level of Fees and Charges
- Reducing or stopping services
- Transforming services - provide services in a different way for example by working with partners, or by increasing efficiency.
- Effectively managing our Assets - including reducing the costs of running our buildings, for example by changing how our buildings are used and managed or by selling off some property.
“Effectively managing our Assets” was the most preferable way of balancing the budget very closely followed by “Transforming Services”.
The least preferable way of balancing the budget was “Reducing or stopping services”, followed by “Raising the level of Council Tax”.
| Option | 1 | 2 | 3 | 4 | 5 | Score (low is positive) | Overall rank (1 is most preferable, 5 is least preferable) |
|---|---|---|---|---|---|---|---|
| Effectively managing our assets | 357 | 259 | 71 | 4241 | 41 | 1461 | 1 |
| Transforming services | 317 | 292 | 108 | 39 | 21 | 1486 | 2 |
| Raising the level of fees and charges | 58 | 83 | 283 | 260 | 92 | 2573 | 3 |
| Raising the level of Council Tax | 66 | 42 | 110 | 201 | 353 | 3049 | 4 |
| Reducing or stopping services | 45 | 31 | 174 | 135 | 381 | 3974 | 5 |
Question 6
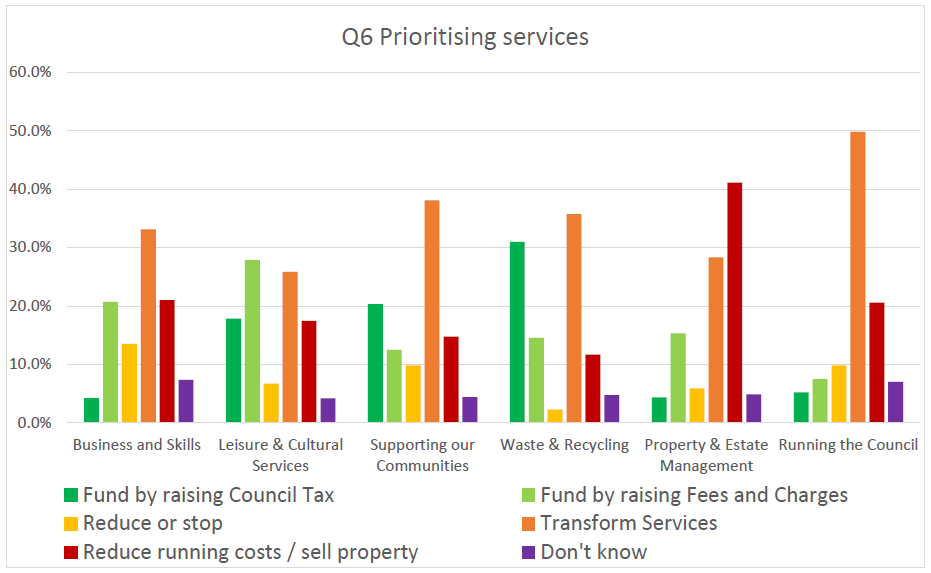
Which of the following statements do you mostly agree with? (Please tick one option per service area).
- These services should be mainly funded by raising the level of Council Tax
- These services should be mainly funded by raising the levels of Fees and Charges
- The Council should reduce or stop some of these services to save money
- The Council should transform these services to make savings
- The Council should reduce the costs of running its buildings and/or sell off some of its property to fund these services
- Don’t know.
Business and Skills – People mostly want to see these services transformed. Others would rather these services be funded through reducing running costs / selling property and by raising fees and charges.
Leisure & Culture - People mostly want to see these services funded by raising fees and charges or by transforming services.
Supporting our Communities – People mostly want to see these services transformed.
Waste & Recycling - People mostly want to see these services transformed. More people would like these services funded by Council Tax as opposed to fees and charges.
Property & Estate Management – People mostly want these services funded by reductions in running costs and selling property. Others would like to see these services transformed.
Running the Council – To a significant degree, people mostly want to see these services transformed.
Overall, respondents did not want to see services reduce or stop, in particular around waste and recycling.
| Option | Fund by raising Council Tax | Fund by raising fees and charges | Reduce or stop | Transform services | Reduce running costs / sell property | Don't know |
|---|---|---|---|---|---|---|
| Business and skills | 4.3% | 20.7% | 13.5% | 33.1% | 21.0% | 7.3% |
| Leisure and cultural services | 17.9% | 27.9% | 6.7% | 25.9% | 17.5% | 4.2% |
| Supporting our communities | 20.3% | 12.5% | 9.8% | 38.1% | 14.8% | 4.4% |
| Waste and recycling | 31.0% | 14.6% | 2.3% | 35.8% | 11.7% | 4.8% |
| Property and estate management | 4.4% | 15.3% | 5.9% | 28.4% | 41.2% | 4.9% |
| Running the Council | 5.2% | 7.5% | 9.9% | 49.8% | 20.6% | 7.1% |
Question 7
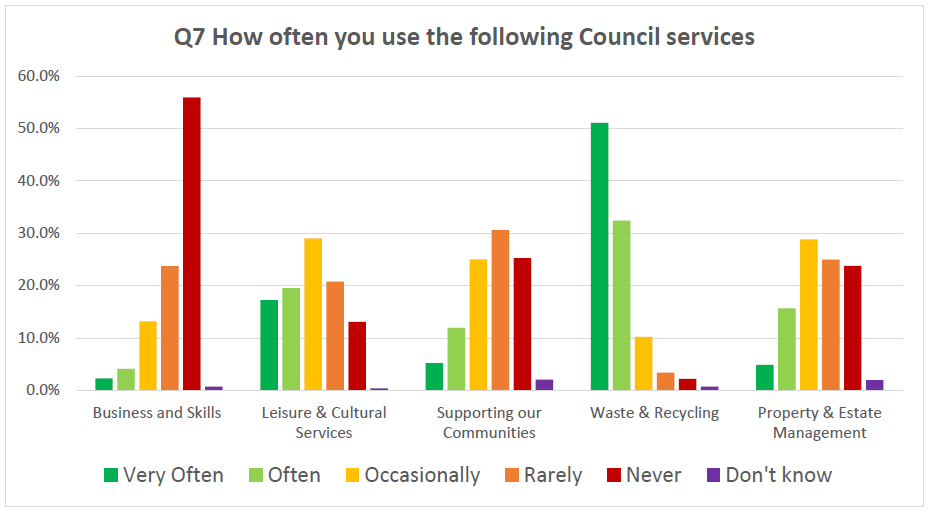
How often do you use the following Council services?
In the main, respondents report using waste and recycling services “very often” or “often”, Property & Estate Management and Leisure & Cultural Services “occasionally”, Service Supporting our Communities “rarely”, and Business and Skills “never” or “rarely”.
| Services | Frequency - Never | Frequency - Rarely | Frequency - Occasionally | Frequency - Often | Frequency - Very often | Frequency - Don't know |
|---|---|---|---|---|---|---|
| Business and skills | 55.9% | 23.7% | 13.5% | 4.1% | 2.3% | 0.7% |
| Leisure and cultural services | 13.1% | 20.8% | 29.0% | 19.5% | 17.2% | 0.4% |
Question 8
Are there any other ways we can use to balance the budget?
Ways identified include:
- Vacancy control, reducing staffing numbers and associated costs.
- Reducing agency staff spend.
- Reducing the number of senior and middle management positions.
- Reducing back-office functions and increasing front-line positions.
- Staff – increasing remote working and reducing sickness absence.
- Making better use of Council buildings including town halls.
- Purchasing empty properties and let them as flats.
- Reducing expenses and overheads.
- Focusing on essential services.
- Reducing services and resources.
- Joint working with other councils in all tiers.
- Closer work with partners.
- Improving asset management to generate revenue.
- Becoming more commercial.
- Reducing duplication and mering services.
- Reducing the number and expenses of Councillors.
- Reorganising Local Government.
- Reducing bureaucracy.
- Introducing tenancy system for market stallholders to guarantee income to council.
- Closing public toilets.
- Reducing mowing of grass verges.
- Improving procurement practices.
- Less virtue-signalling and vanity projects.
- Car parking – reducing prices near town centre and increasing elsewhere.
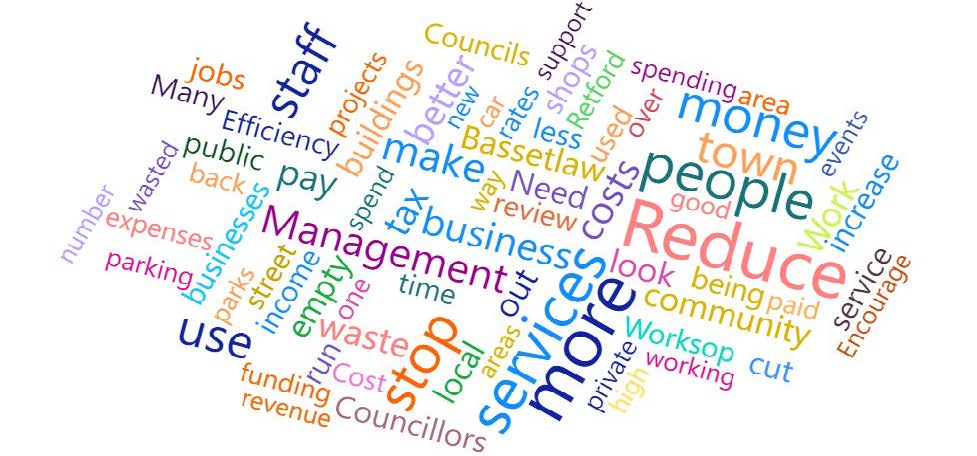
Word cloud of most used words:
Demographic profile of respondents
Age
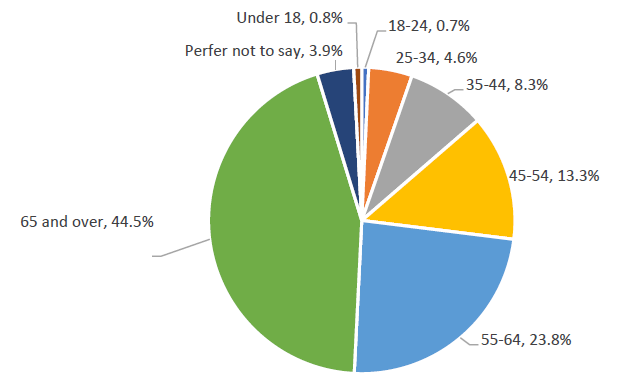
| Age Group | Percentage |
|---|---|
| Under 18 | 0.8% |
| 18 - 24 | 0.7% |
| 25 - 34 | 4.6% |
| 35 - 44 | 8.3% |
| 45 - 54 | 13.3% |
| 55 - 64 | 23.8% |
| 65 and over | 44.5% |
| Prefer not to say | 3.9% |
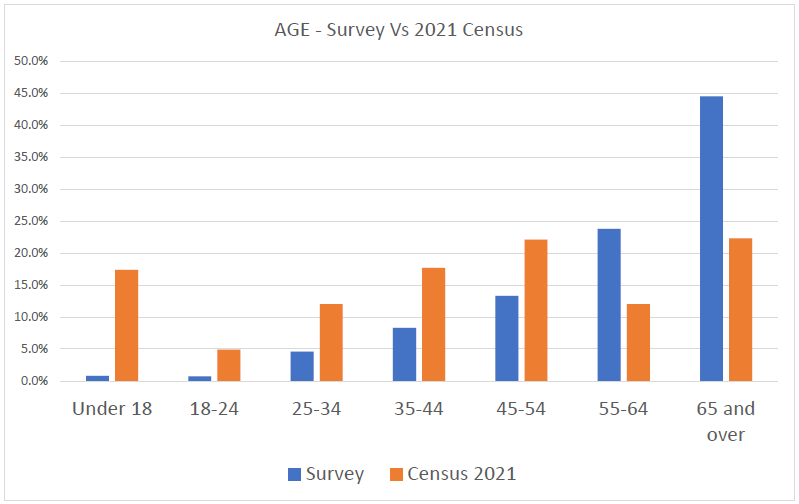
As shown above, this survey is under-representative of the age groups 18-54 and over-representative of age groups 55-64 and 65 and over.
Gender
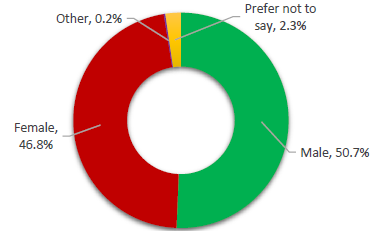
| Gender | Percentage |
|---|---|
| Female | 46.8% |
| Male | 50.7% |
| Other | 0.2% |
| Prefer not to say | 2.3% |
Disability
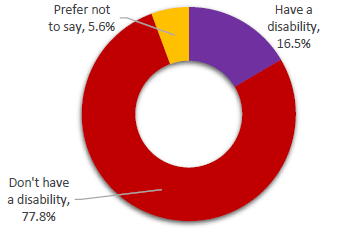
| Response | Percentage |
|---|---|
| I have a disability | 16.5% |
| I don't have a disability | 77.8% |
| Prefer not to say | 5.6% |
Ethnicity
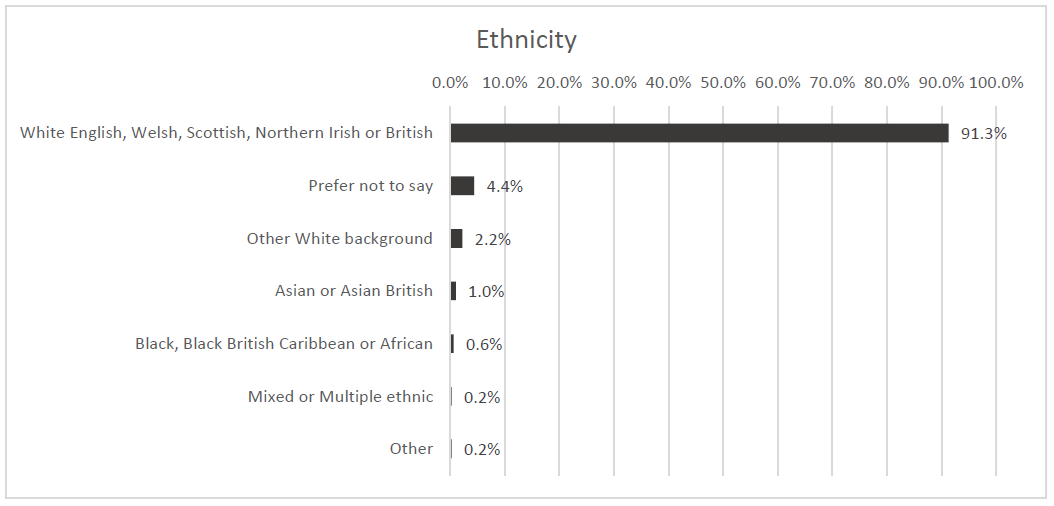
| Ethnicity | Percentage |
|---|---|
| White English, Welsh, Scottish, Northern Irish or British | 16.5% |
| Prefer not to say | 4.4% |
| Other White background | 2.2% |
| Asian or Asian British | 1.0% |
| Black, Black British Caribbean or African | 0.6% |
| Mixed or multiple ethnic | 0.2% |
| Other | 0.2% |
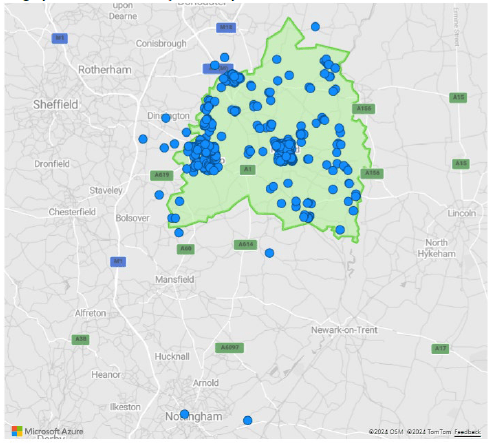
Geography
Last Updated on Monday, February 3, 2025